 Home
Home
Research Publications Talks Personal First Data Release and Photometric Classification of the Young Supernova Experiment (YSE) Survey
Advisor: Prof. Gautham Narayan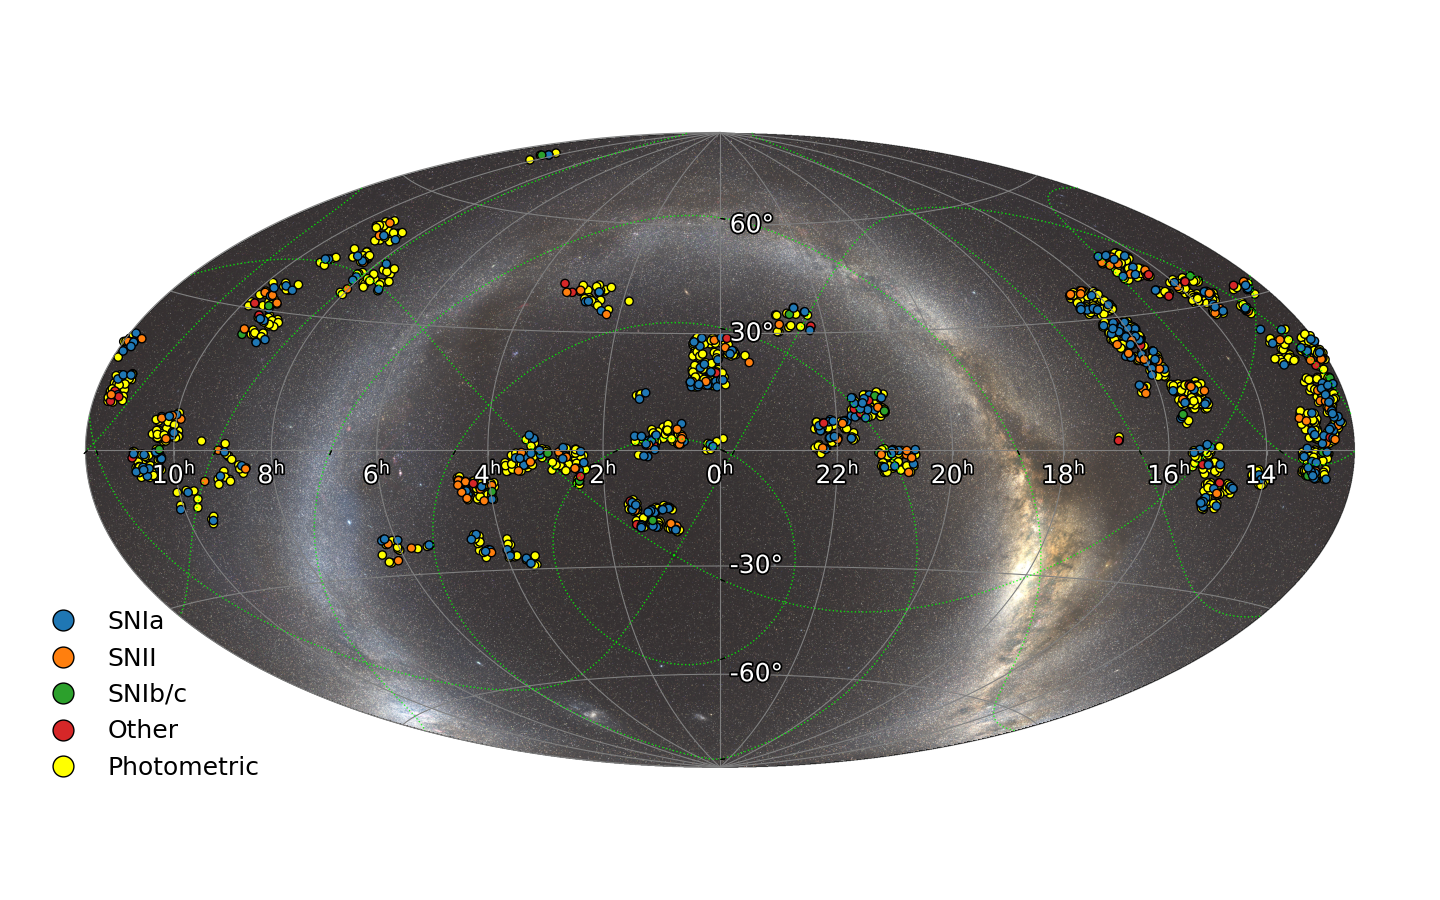
I lead the First Data Release (DR1) for the Young Supernova Experiment (YSE) Survey’s first ~2 years of operation on the Pan-STARRS telescopes, a survey designed to build statistical samples of young, red, and rare transients, better understand black hole variability, and to constrain the fundamental cosmological parameters of the universe. Moreover, I generated cutting edge sumulations, trained the hybrid physics-VAE model ParSNIP for multi-band time-evolving photometric classification of 1975 YSE DR1 transients, and integrated the classifier to characterize such supernovae. This was a huge effort on behalf of the entire YSE collaboration, and this work would not have been possible without their help!
SNAD Miner: Finding Missed Transient Events in ZTF DRs
Advisors: Prof. Gautham Narayan, Dr. Emille E. O. Ishida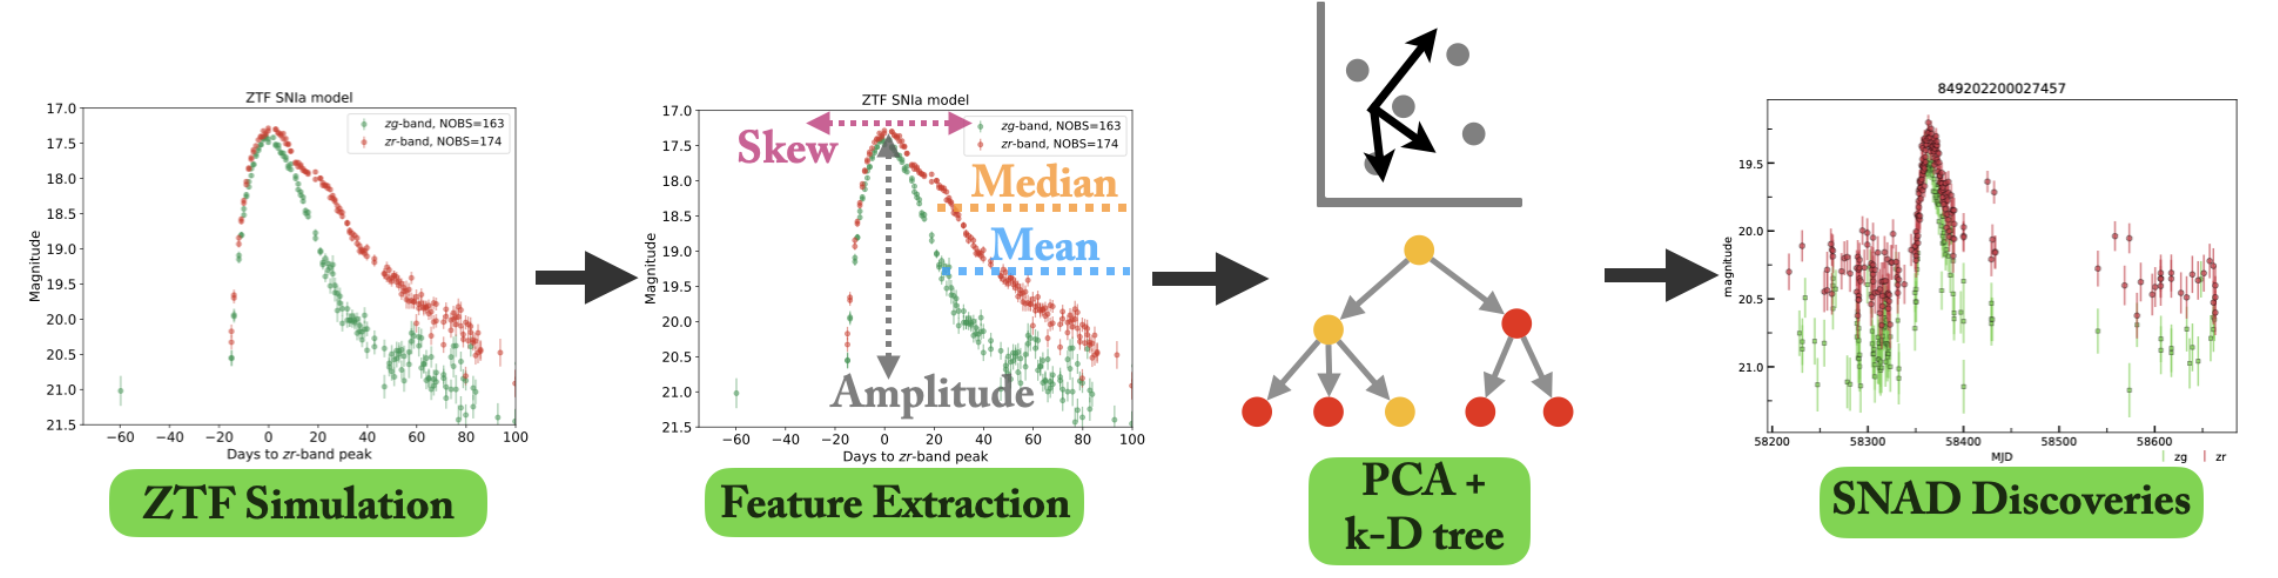
At the SNAD-IV Workshop, I pioneered a new method to calculate light curve features of simulations and use k-D trees and PCA to search for nearest matching light curve features of missed transient events in ZTF Data Releases. As a result, I found 11 missed transients (7 supernovae, 4 active galactic nuclei candidates). Because these objects were not discovered while they were active, key science to understanding such events are lost. Thus, I am currently using the SNAD Miner to estimate a lower limit of missed transients to date, and use these insights to prevent future similar losses with future surveys such as LSST. To date, the SNAD Miner has found upwards of 200 of missed supernovae.
Real-time Anomaly Detection
Advisor: Prof. Gautham Narayan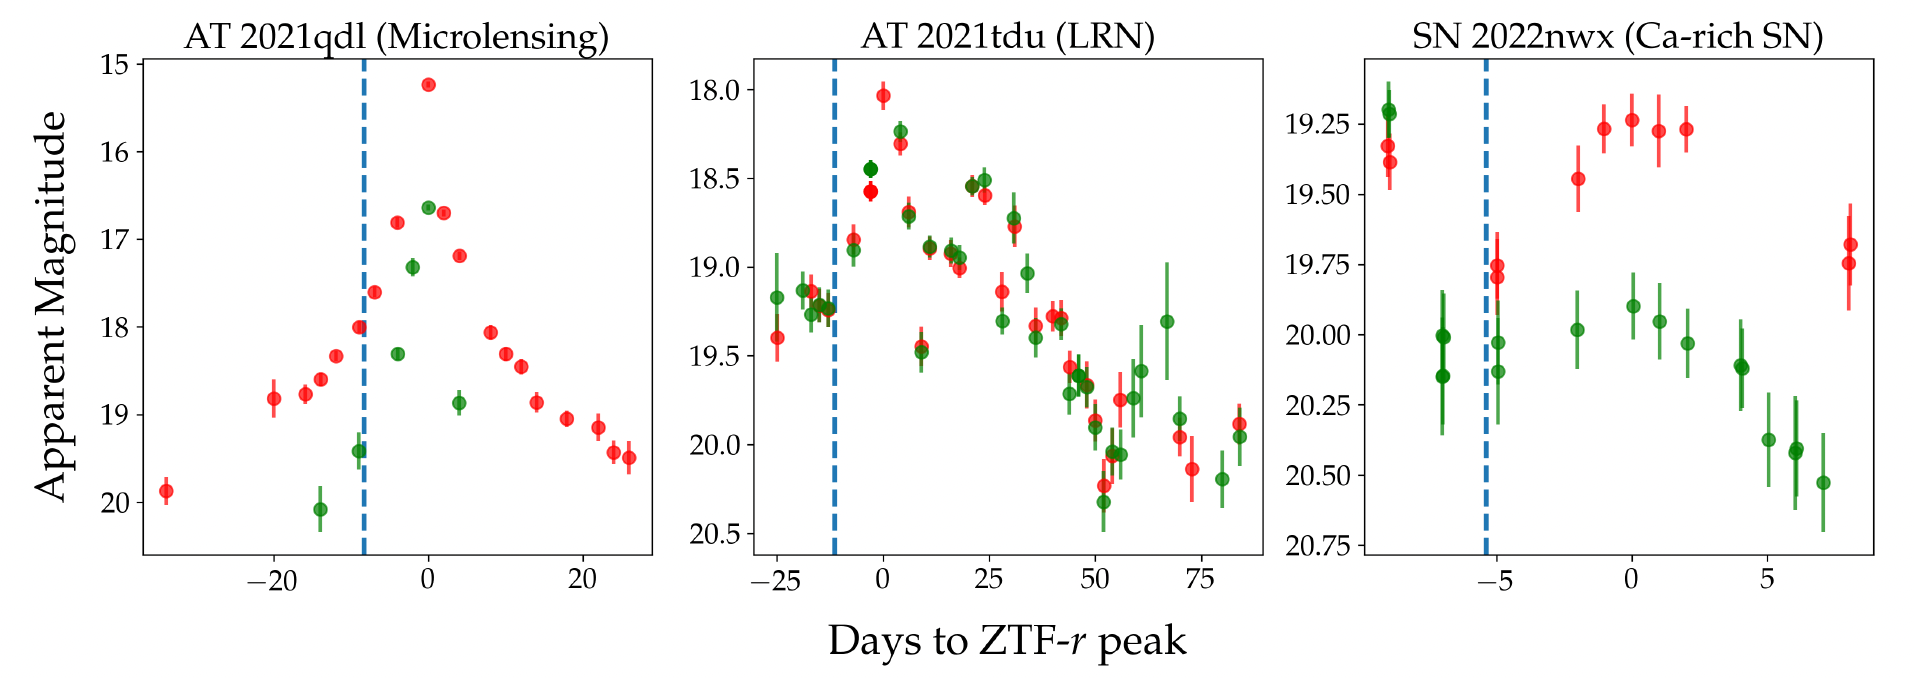
Using an isolation forest algorithm, I built a real-time anomaly detection filter for ZTF broker ANTARES using machine learning techniques to detect and report transient events to prioritize objects for spectroscopic follow-up. Highlights include a rare microlensing event, supernovae (SN Ia, II, IIn, etc.), and a luminous red nova in the Andromeda Galaxy---the neighbor of our own Milky Way Galaxy.
Astro R-CNN: Application of Mask R-CNN Deep Learning for Galaxy Image Deblending and Instance Segmentation
Advisor: Prof. Xin Liu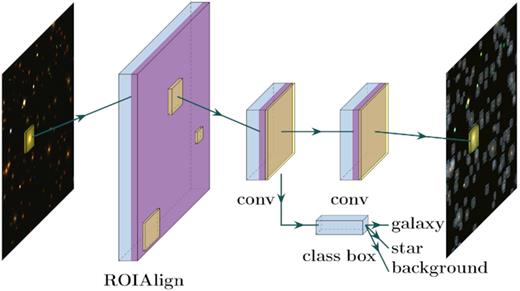
With fellow graduate student Colin J. Burke, we developed the first application of the Mask R-CNN framework (He et al. 2017)---an architecture used in self-driving cars---to detect, classify, and deblend sources in multiband astronomical images. This technique, or extensions using similar network architectures, may be applied to current and future deep imaging surveys such as Large Synoptic Survey Telescope and Wide-Field Infrared Survey Telescope. After publication, we extended the project and have mentored and advised two undergraduate students, Anshul Shah (view SPIN poster) and Yufeng Liu, through the NCSA SPIN research program.
Fun fact: this idea was born out of a final class assignment!
Visualizing the Moon-forming synestia informed by machine learning clustering
Advisors: Prof. Donna J. Cox, Prof. Matthew J. Turk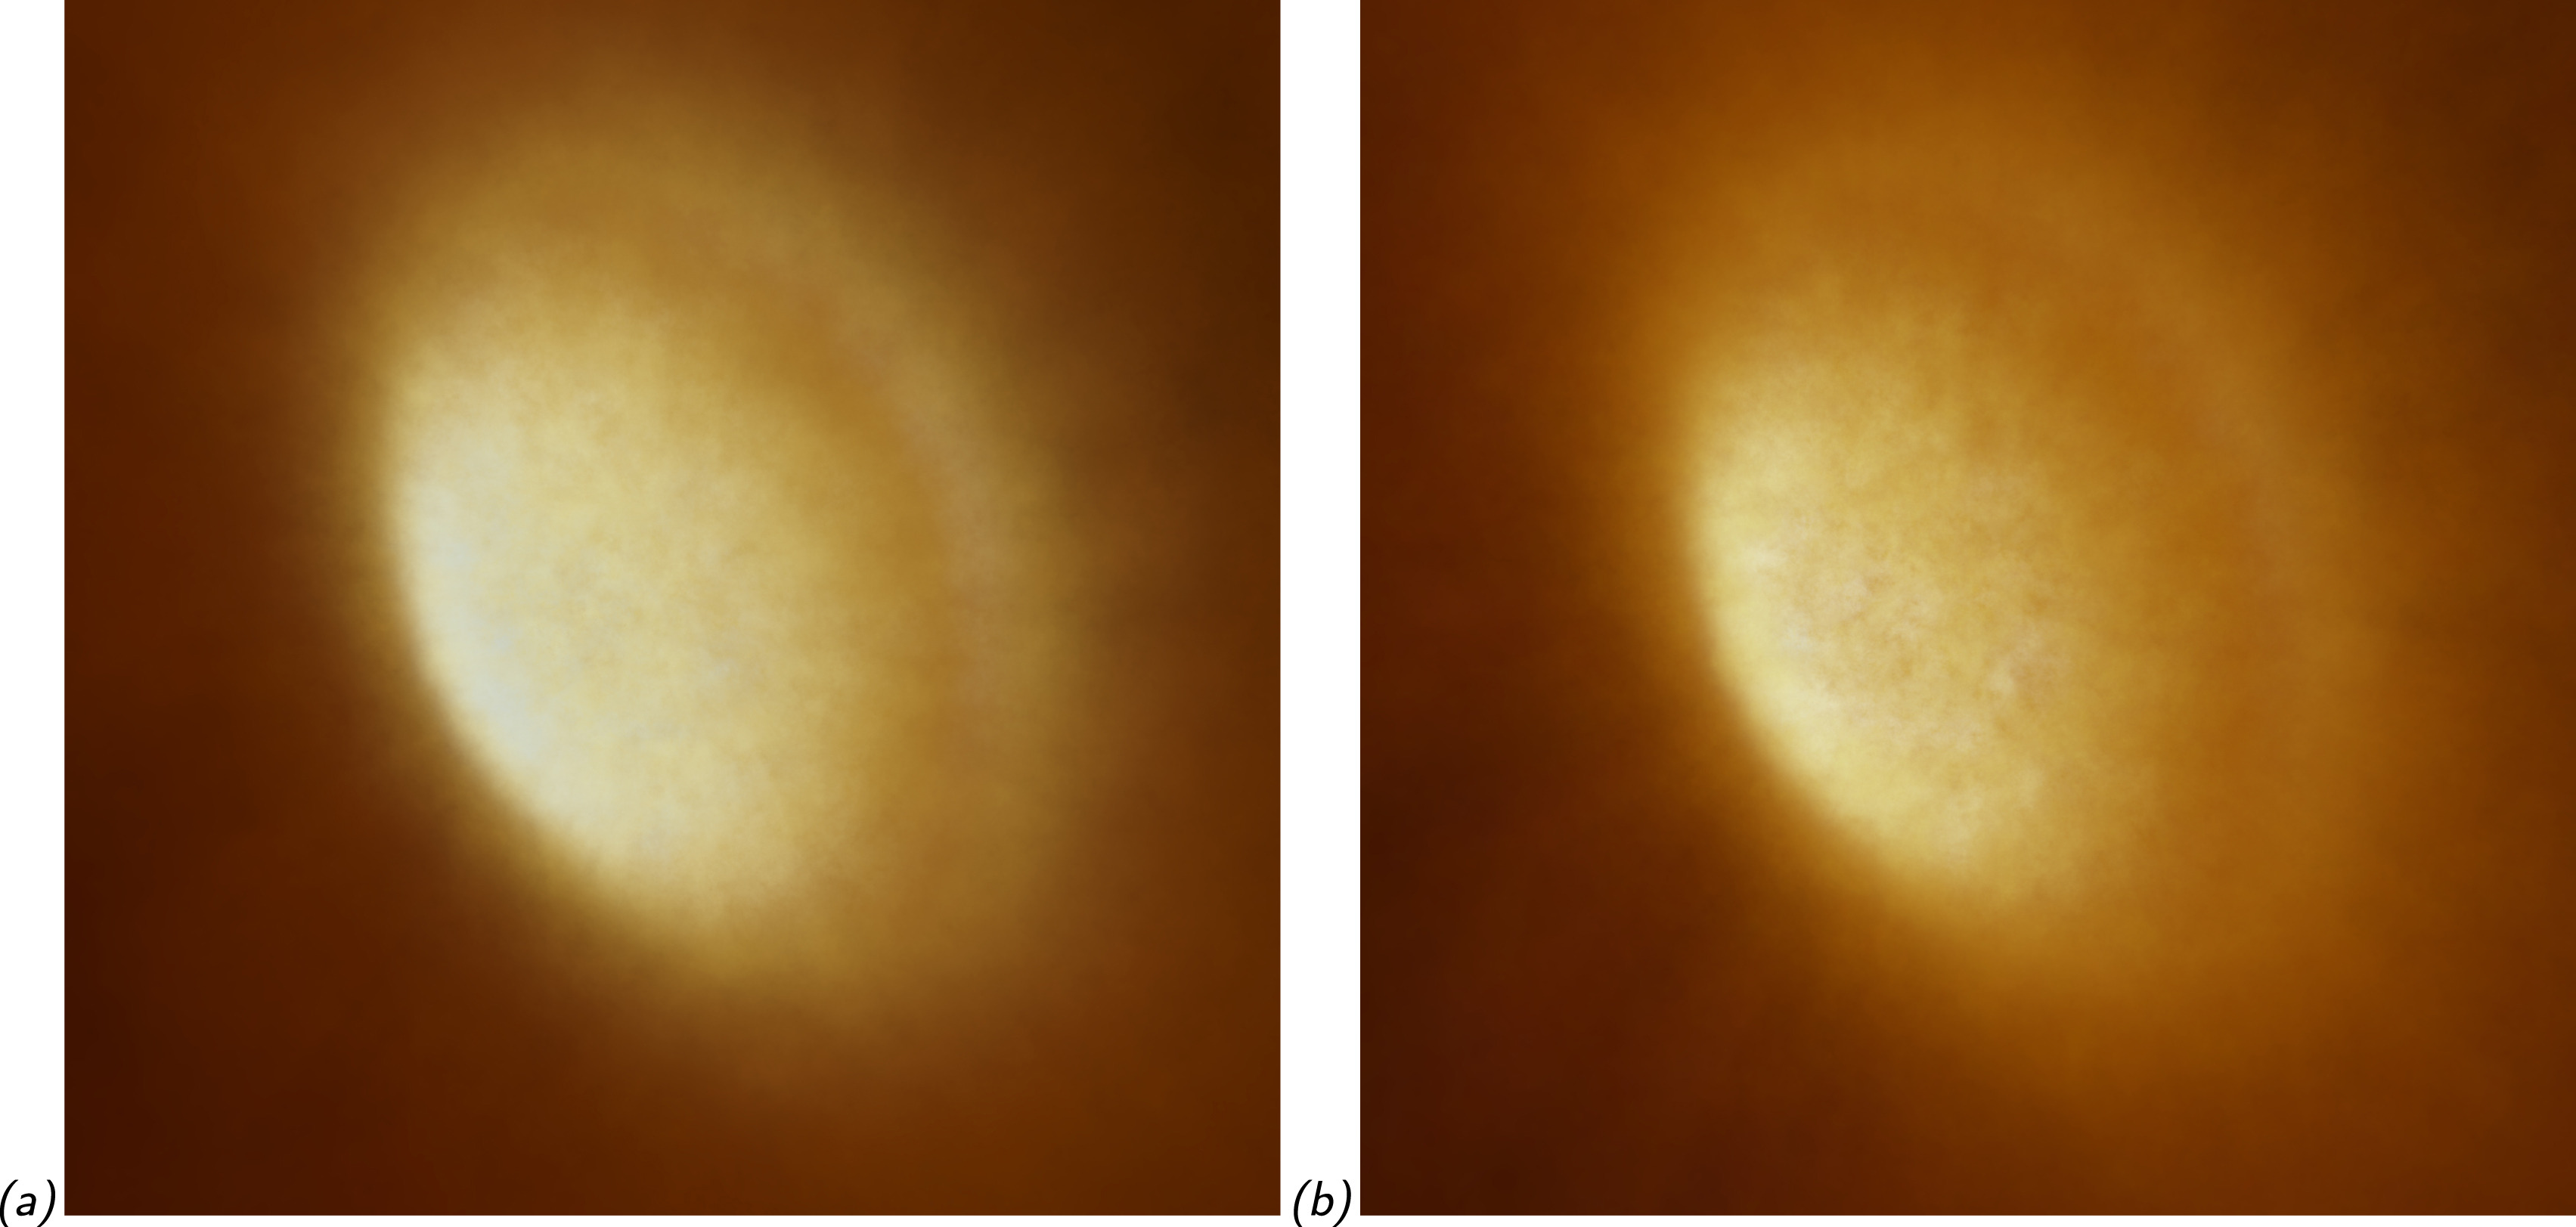
My project, Estra, enables scientists to become their own storyteller through automating, informing, and improving astrophysical data visualization using machine learning algorithms. This approach utilizes "physically interpretable" clusters corresponding to physically meaningful structures within the simulation data to inform the color mapping transfer function and a shading network to map opacity, brightness, falloff, and other attributes. Here is a demonstration of Estra applied to the Moon-forming synestia: a super-coronation limit body resulting from the high-energy, high-angular momentum impact of a celestial protoplanetary body with Earth, from which the Moon coalesces. The hot, dense core radiates vividly with a white/yellow hue, and is surrounded by a ring of cooler condensates and material. The synestia hypothesis explains the physical and chemical properties of the Moon, and this visualization provides a possible representation of our shared history billions of years ago.